Product strategy, UX, and full-stack build
INDEPENDENT F1 DATA PRODUCT
APEX F1
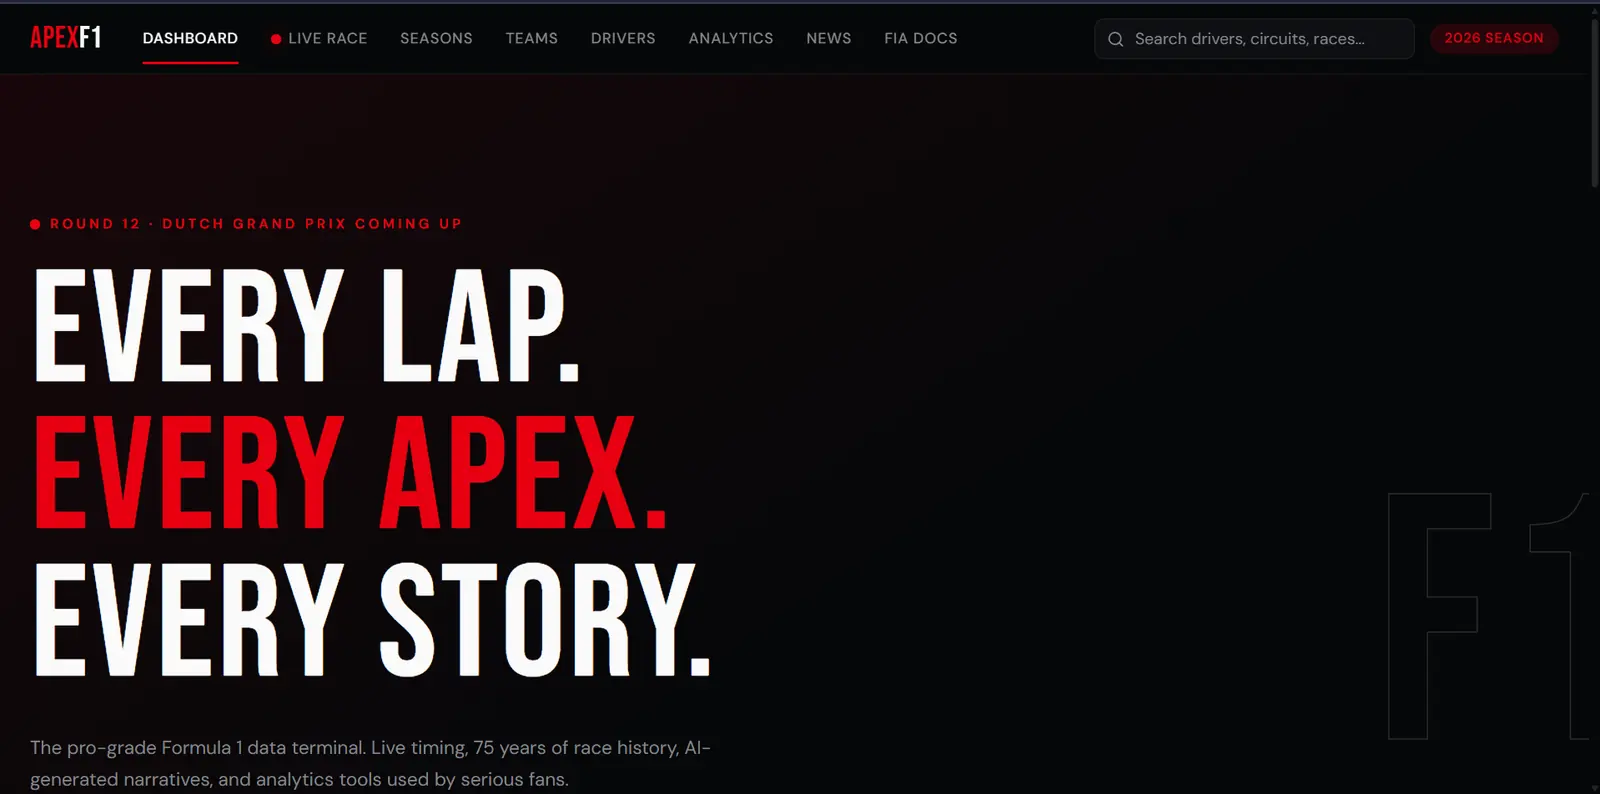
I built the Formula 1 product I wanted to use: one place to scan the current season, revisit every Grand Prix since 1950 and replay telemetry-rich races from 2018 onward.
SIGNAL
PROBLEM
DECISION
PRODUCT
LEARNING
— PROJECT SNAPSHOT
60-SECOND READ01 / THE PROBLEM
Fans must switch tools for live context, historical exploration, and telemetry
Layer the experience (scan, explore, replay) to manage information density
Integrated Formula 1 data platform
No formal user testing; independent project
Working product; usability unvalidated
01
Signal
As an F1 fan, I could follow the current championship or dig through historical data—but the journey between live context, archive and telemetry was fragmented.
The useful view changed with the question.
On race weekends I wanted a fast read of standings and momentum. When curiosity went deeper, I wanted seasons, constructors, drivers and individual races without starting over in another tool.
Connect the layers instead of adding another dashboard.
The opportunity was an information system that could begin with the current race story and progressively reveal decades of results, entity profiles and telemetry.
02
Problem
The challenge was not a lack of Formula 1 data. It was creating continuity across very different depths and eras of that data.
REFINED PROBLEM STATEMENT
How might I connect the live season, every Grand Prix since 1950 and telemetry-driven race replay in one coherent product—without turning the first screen into a dense statistics terminal?
INFORMATION MODES
Quick season scan, historical exploration, entity comparison and lap-by-lap replay each require a different density.
DATA AVAILABILITY
Race records span 1950 onward, while the richer telemetry required for simulations is available from 2018.
SYSTEM DEPENDENCY
Current results, historical APIs, FastF1 telemetry and AI interpretation have different reliability and latency profiles.
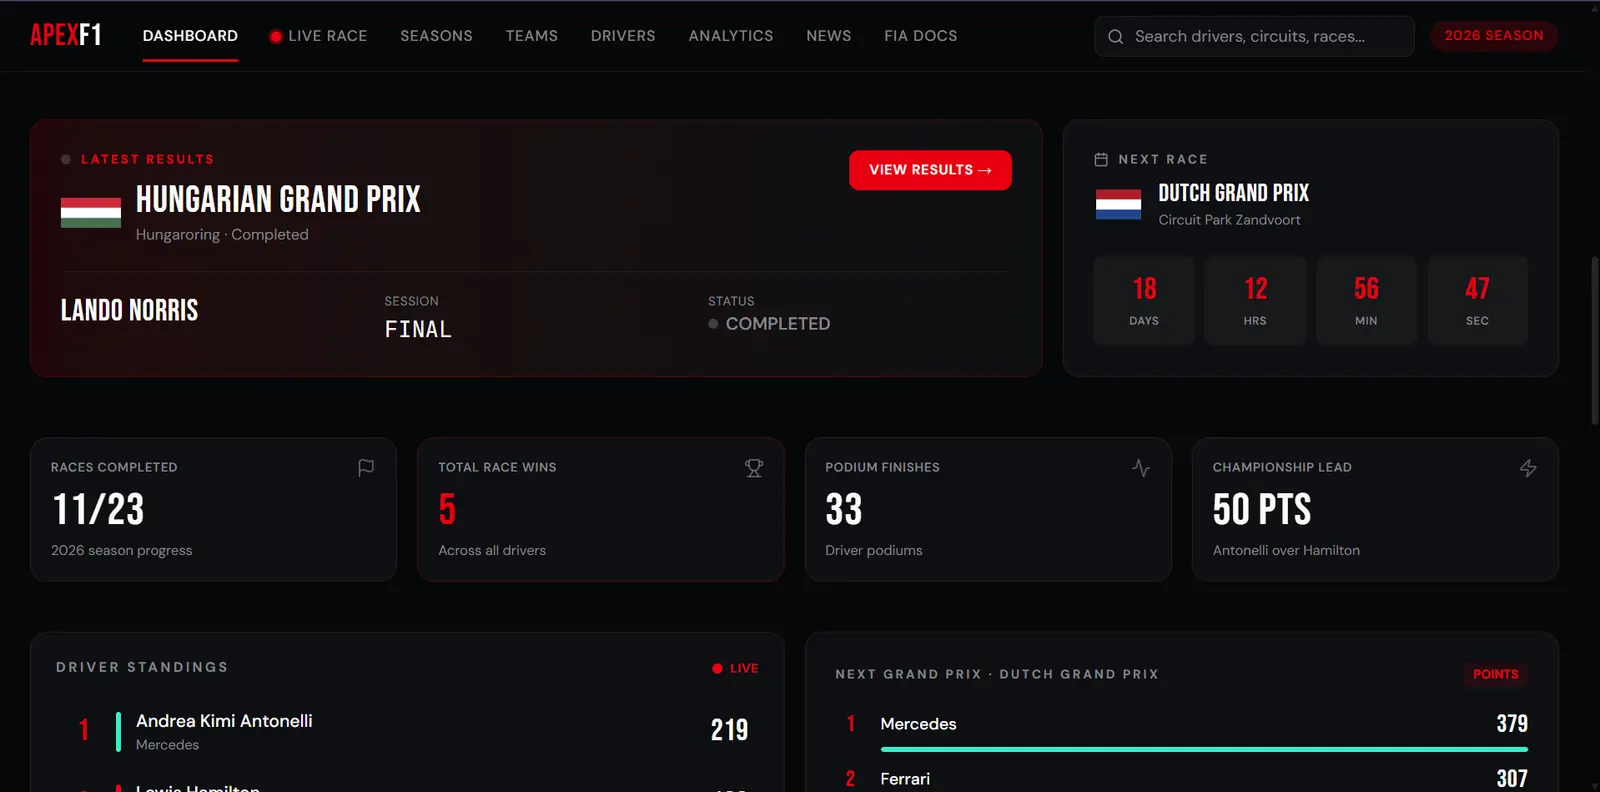
Current race, standings and next event
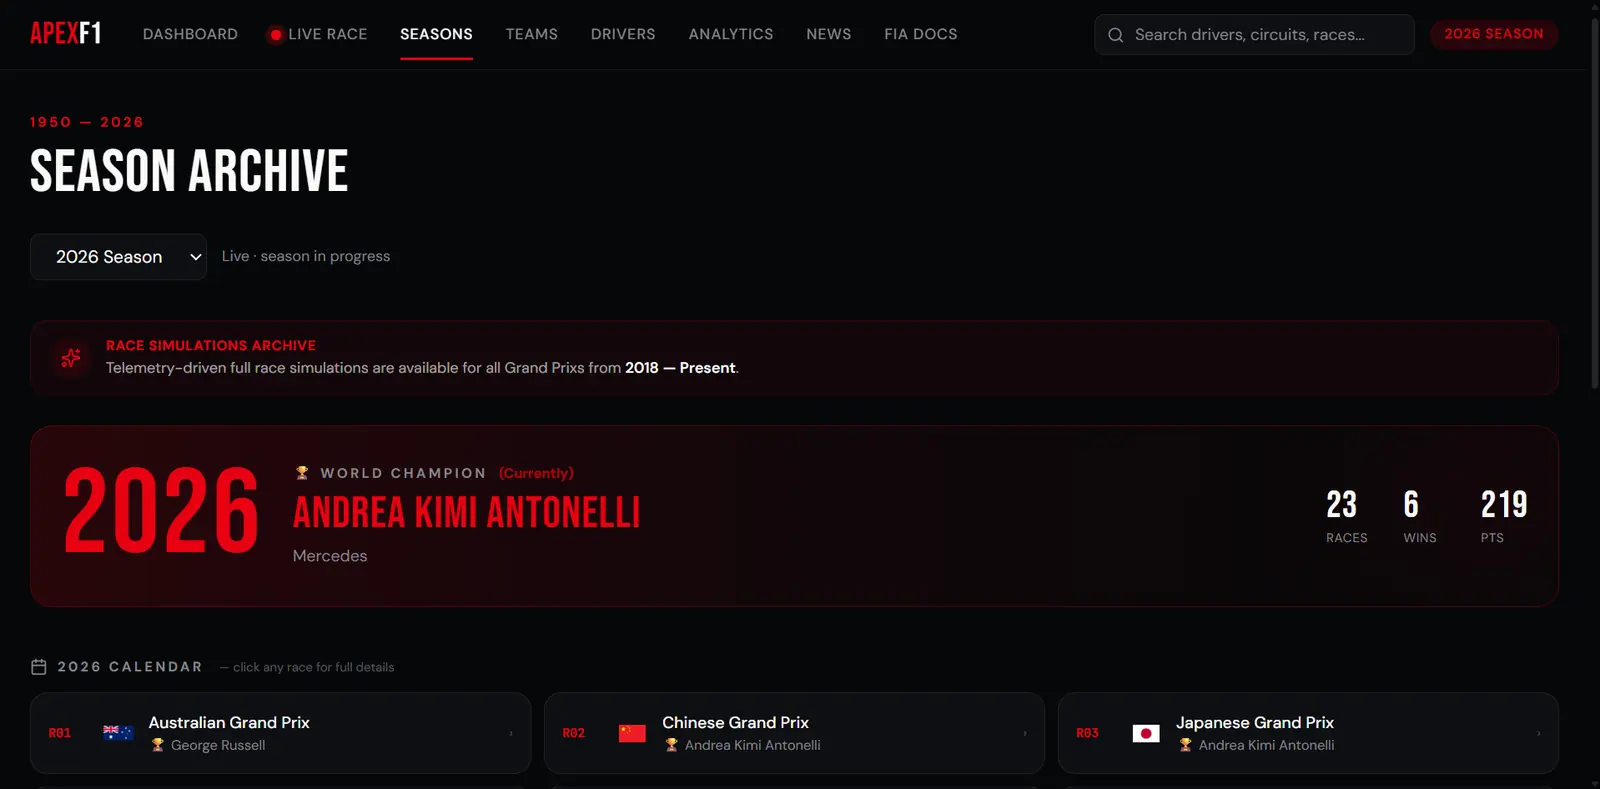
Seasons, teams, drivers and race records
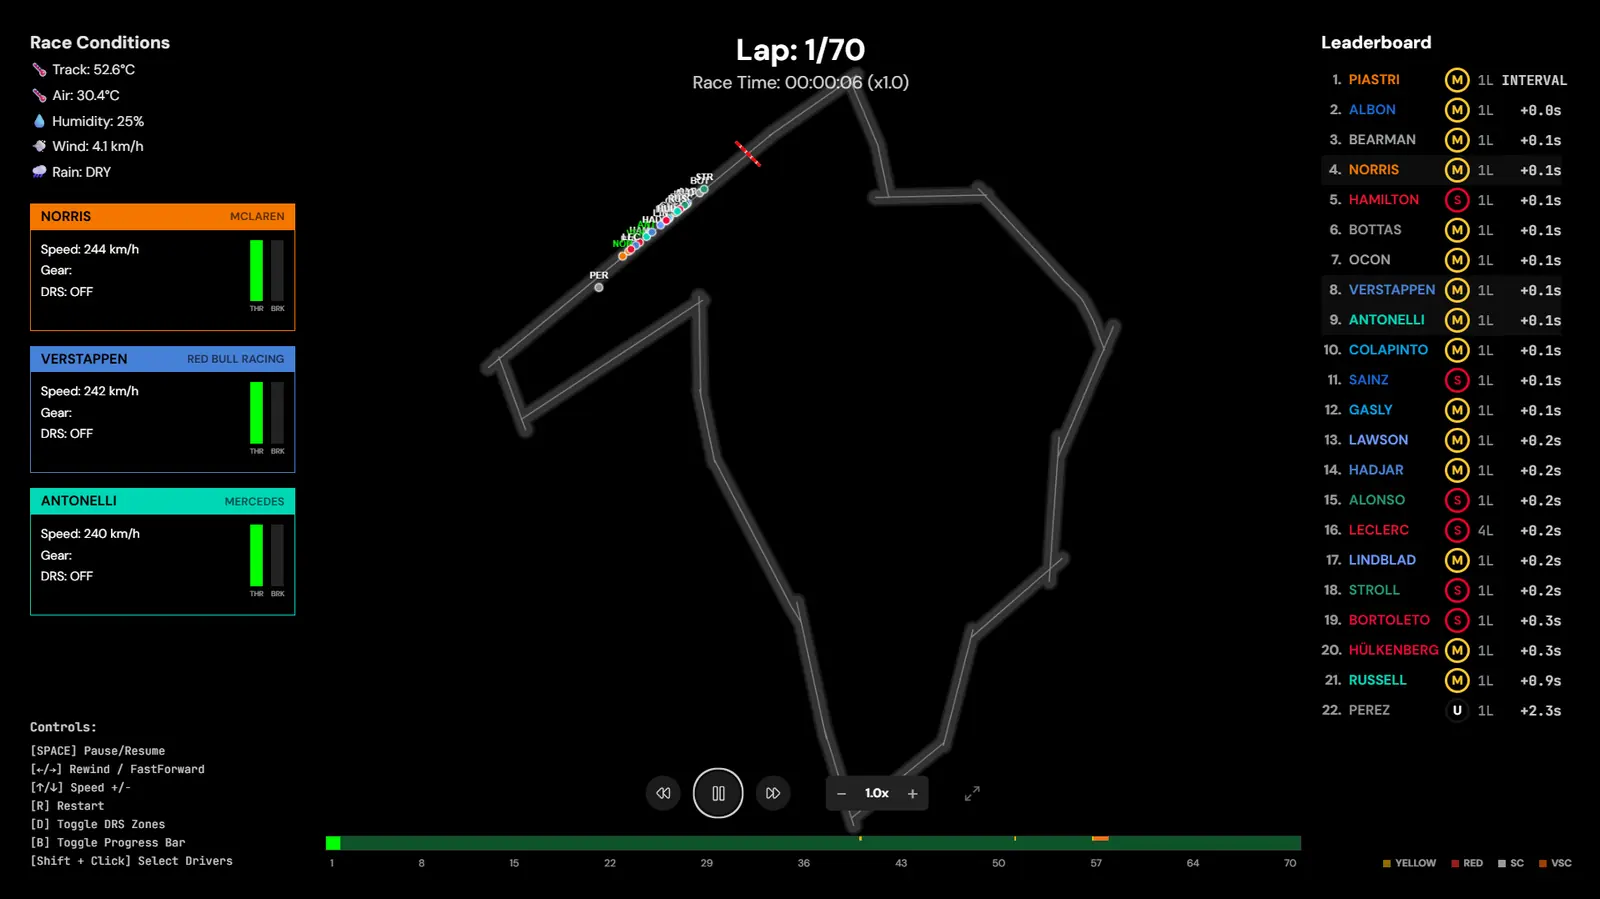
Lap, position, conditions and race events
03
Decision
I chose a layered system: a quick entry point, a consistent historical archive and a separate telemetry mode for races that support it.
One chronological spine from 1950 to today.
A consistent season-and-race structure makes history navigable before asking the user to understand every available statistic.
Reconstruct recorded telemetry—not fictional race movement.
FastF1 supplies the telemetry foundation. I transformed it into synchronized track position, lap state, leaderboard, weather, tire, speed, gear and DRS views with playback controls.
Keep interpretation separate from recorded race data.
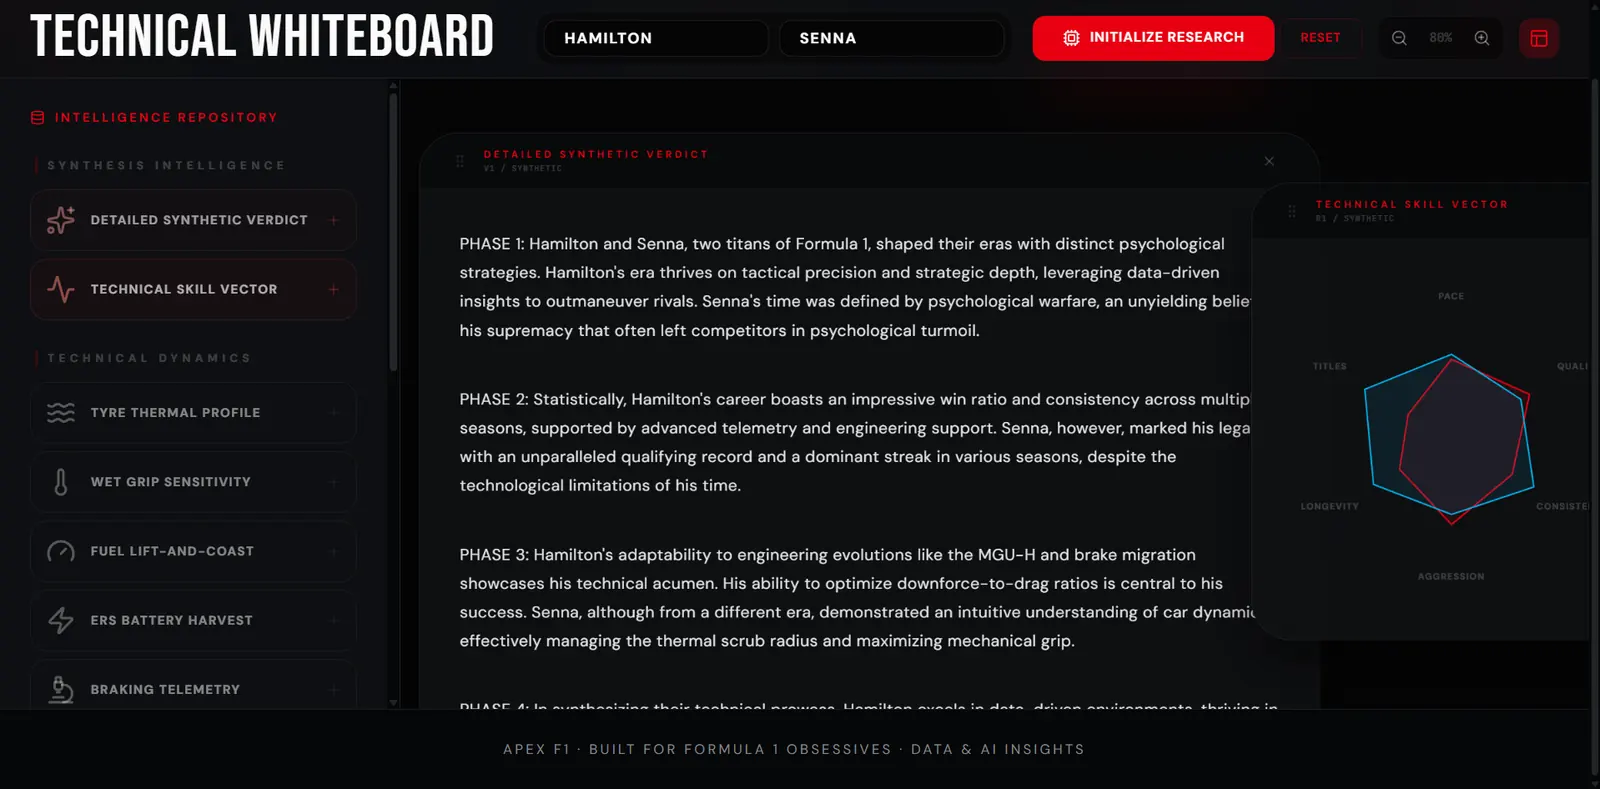
The Technical Whiteboard is an experimental comparison layer. Its generated narratives are presented as synthesis, not as official timing or verified historical fact.
04
Product
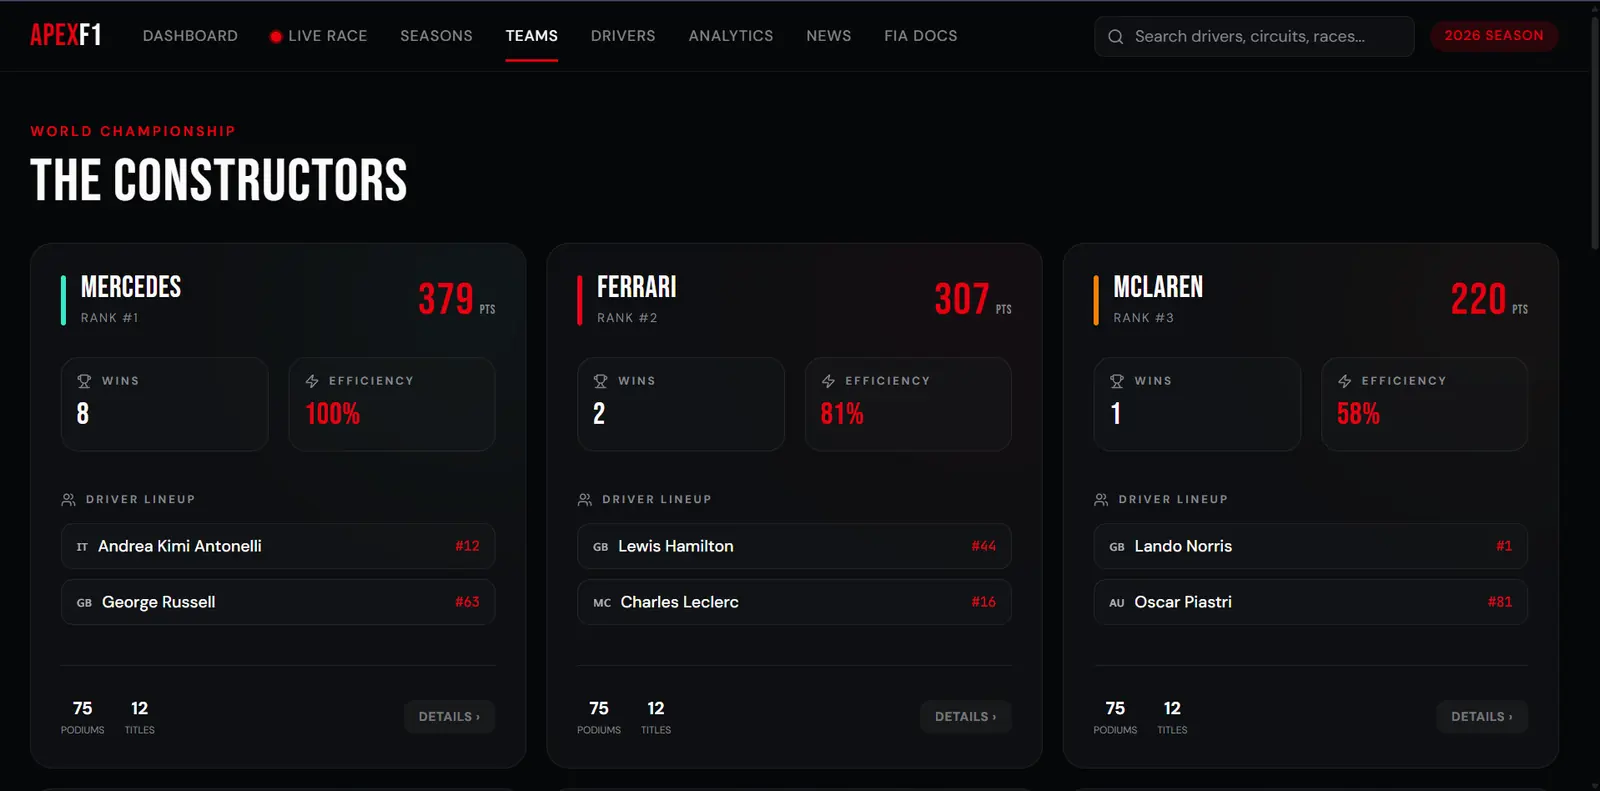
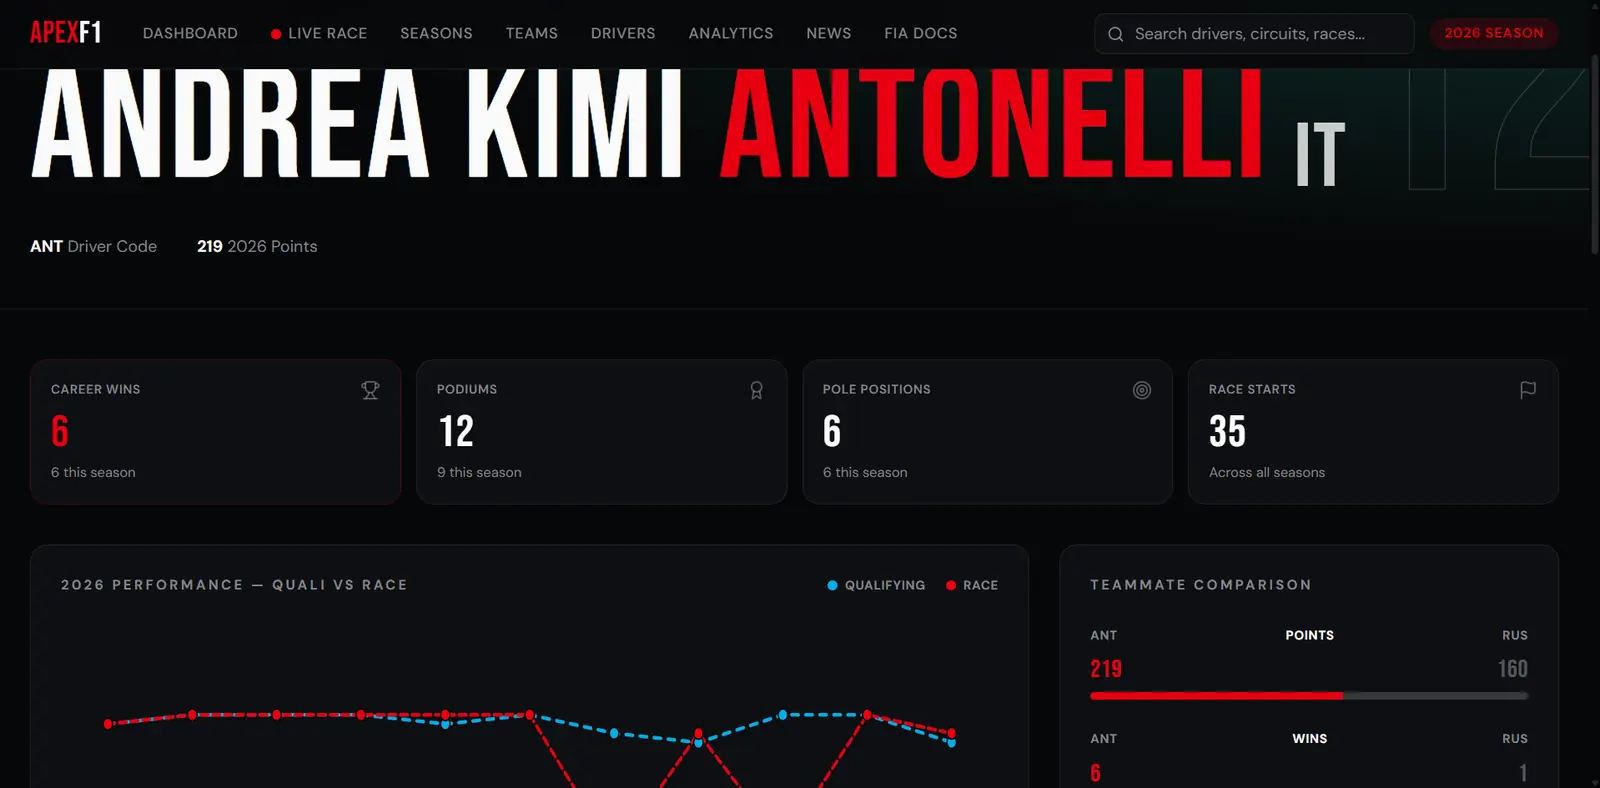
The working product supports three depths: understand what is happening now, explore what happened before, and replay how a supported race unfolded.
RACE NOW
Latest result, next race, standings and season momentum.
EXPLORE HISTORY
Every season from 1950 with races, champions, teams and drivers.
REPLAY TELEMETRY
Telemetry-driven race replays from 2018 with synchronized conditions and events.
COMPARE
Driver profiles, teammate context and experimental AI synthesis.
01React + TypeScript
02TanStack
03Node API layer
04FastAPI service
05FastF1 telemetry
06Interactive replay
BUILT WITHReact 19TypeScriptTanStack Router + QueryTailwindRechartsNode + ExpressPython + FastAPIFastF1Vercel
05
Learning
Building across live, historical and telemetry systems made the limits of the data as important as the interface.
The scan → explore → replay hierarchy gives the product one clear entry point without removing depth for a more invested fan.
A 1950–present archive and 2018–present telemetry layer cannot be treated as one uniform dataset. Capability has to be communicated at the race level.
Replay required more than plotting cars: timing, positions, tire stints, weather, race status and controls had to stay synchronized as one stateful experience.
The product has not been formally user-tested. AI comparisons are experimental, and external data availability can affect live and telemetry features.