Analytics strategy, data preparation and dashboard design
PERSONAL POWER BI ANALYSIS
Spotify
Data Analysis.
I turned an independently sourced Top-50 dataset into a connected view of catalog patterns, artist performance and song-level detail.
QUESTION
DATA
PREPARATION
DASHBOARD
FINDINGS
— PROJECT SNAPSHOT
60-SECOND READ01 / THE PROBLEM
A ranked music dataset did not explain catalog, artist and song performance at the correct level of detail
Use progressive depth instead of one overloaded report page
Three-page interactive Power BI analysis
27,800 chart observations with a documented raw-to-cleaned data boundary
Completed personal analysis; not externally user-tested
01
Question
The project began as a planning exercise: how could a ranked list become a useful analytical journey?
ANALYSIS QUESTION
How might a viewer move from a quick Top-50 scan to a defensible insight about catalog, artist and song performance—without losing the underlying records?
INTENDED PERSPECTIVES
Explore trends and catalog structure.
Compare artists, songs and the records beneath them.
Identify strong performers and changing patterns.
SELF-AUTHORED PLANNING ARTIFACTSpotify Dashboard — Business RequirementsRead the lightweight PDF
02
Data
The raw source captures repeated daily appearances, so rows describe chart observations—not unique songs.
Independently sourced Top-50 dataset
The project uses a downloaded chart dataset as an analytical input. The portfolio reports what is present in that file and avoids presenting it as first-party platform data.
One row per chart appearance
A song can appear on many dates. Counts such as explicit share or average popularity therefore describe observations unless the metric explicitly says “distinct songs.”
Complete source fields
The raw file contains no missing values across the fields used in the analysis. Average popularity is 89.62 and average duration is 3.28 minutes.
03
Preparation
I separated source-file totals from the cleaned Power BI model so the portfolio never presents conflicting numbers.
Profile the source
Prepare fields and model totals
Define reusable measures
Coordinate three analysis pages
04
Dashboard
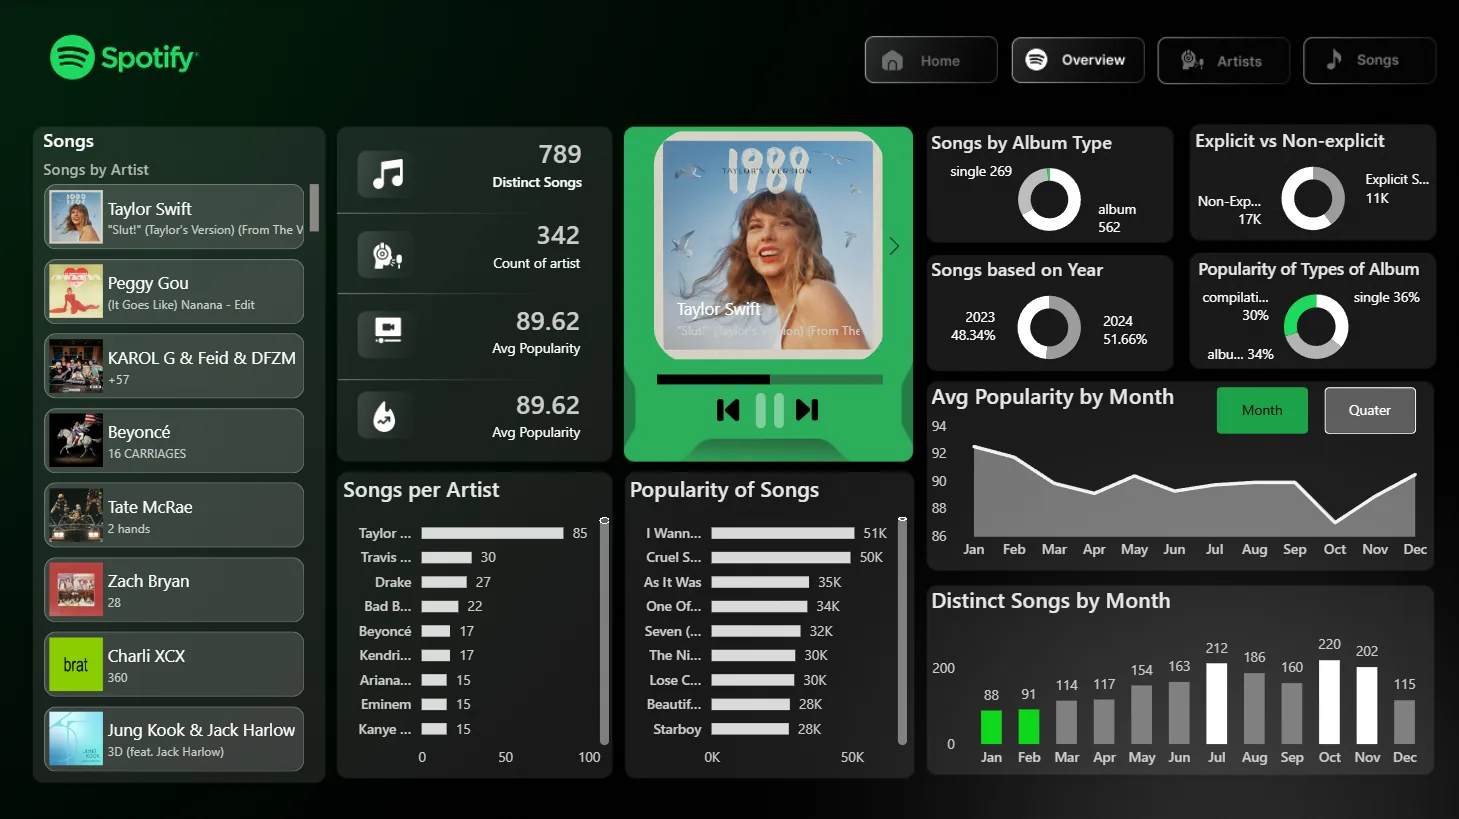
Three coordinated report pages move from a high-level scan to artist and song detail.
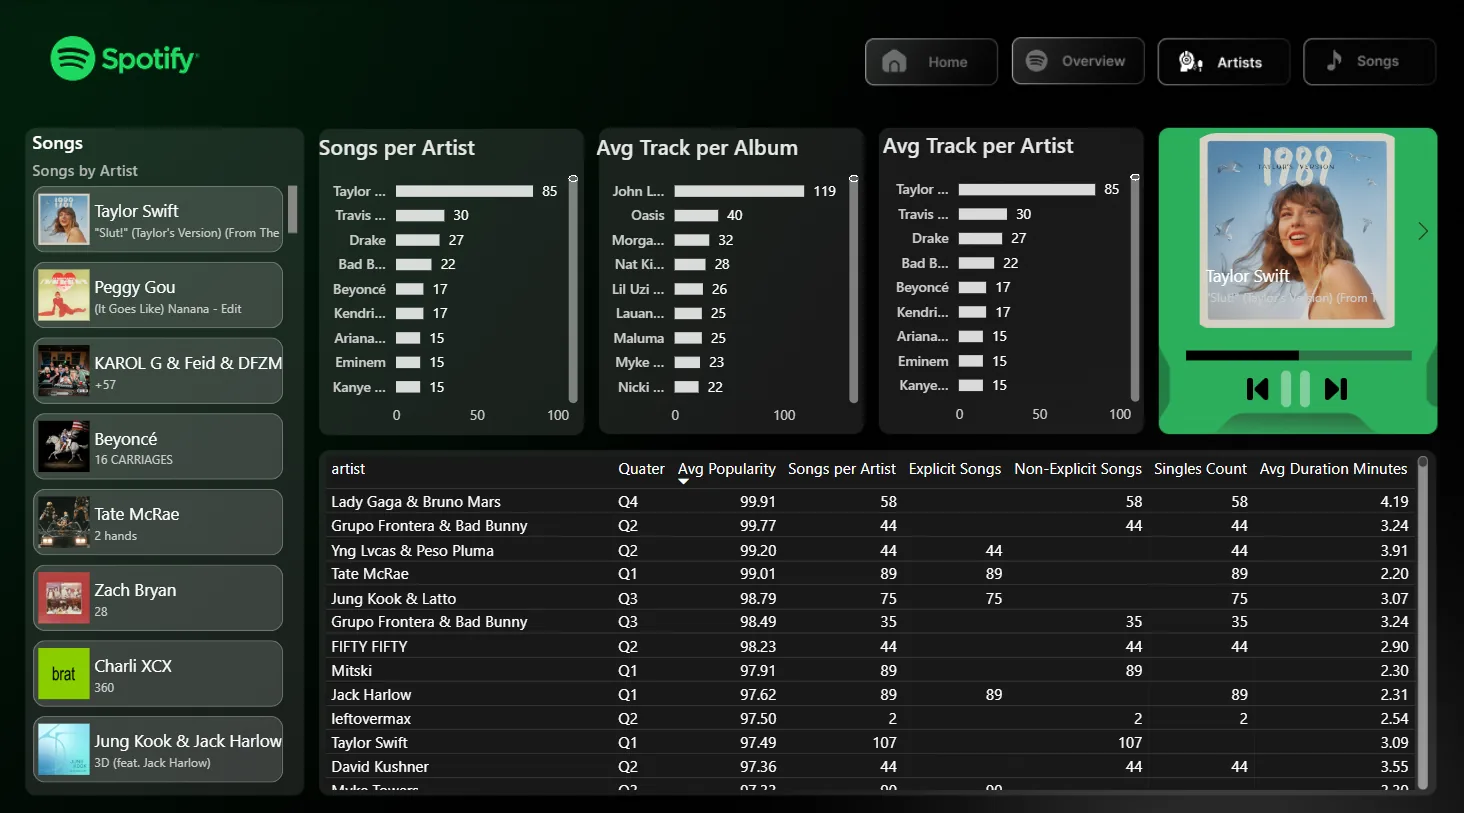
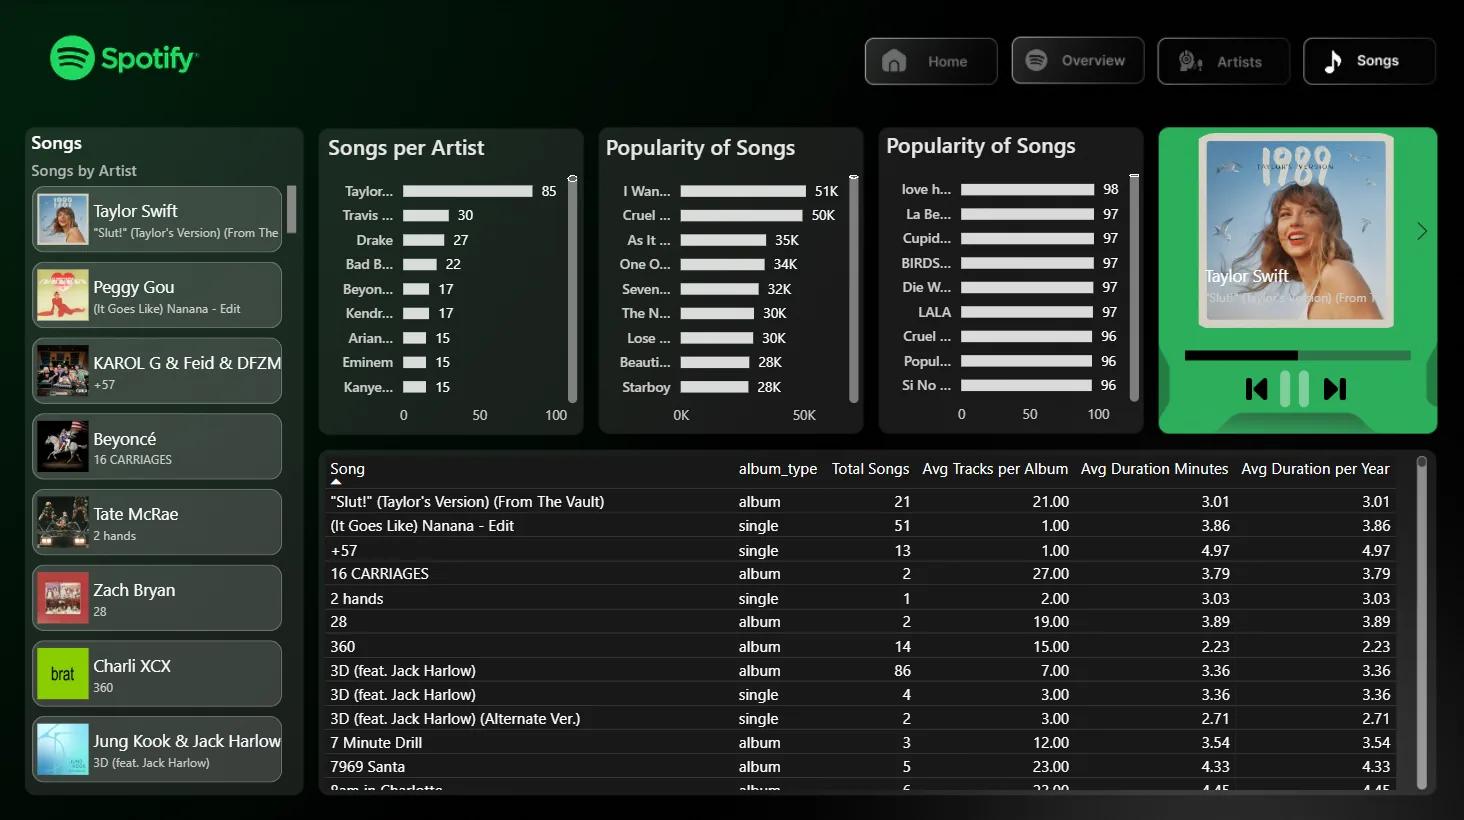
BUILT WITHPower BIPower QueryDAXData modelingInteractive filters
— INTERACTIVE REPORT
Explore the dashboard without making the portfolio heavy.
The Power BI report is not loaded until you choose it. This keeps the normal page fast while preserving the full interactive experience.
05
Findings
The strongest output is not one headline number; it is a set of traceable observations at the correct level of detail.
average popularity across chart observations
daily chart appearances for “I Wanna Be Yours”
number-one days for “Die With A Smile”
distinct Taylor Swift songs in the raw file
of chart observations marked explicit
popularity-point gap between non-explicit and explicit observations
ANALYTICAL READING
Visibility and catalog breadth are different questions.
Repeated chart presence reveals persistence; distinct-song counts reveal catalog breadth; peak days reveal position strength. Keeping those grains separate made the report more honest and more useful than a single “top performer” ranking.